Maximum Temperature
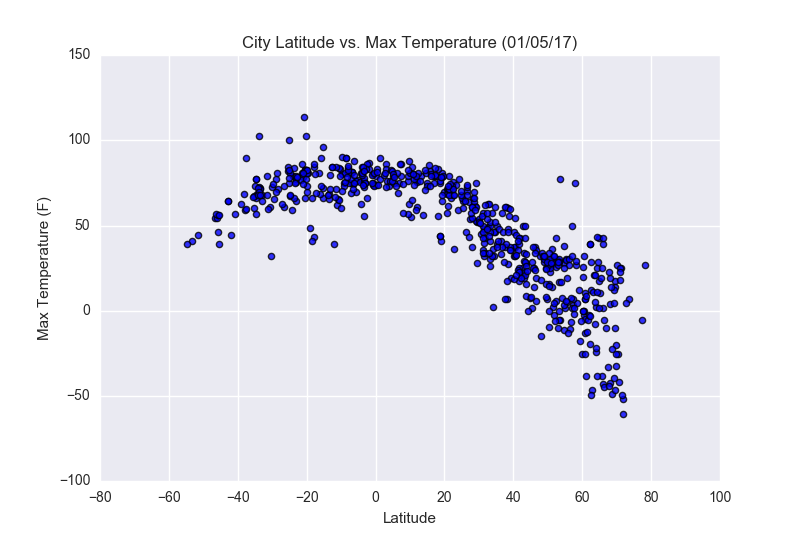
This measurement was taken in January, as we know that means winter in the northern hemisphere. That being said we can observe the much lower temperatures present at the more extreme latitudes in the north, compared to a similar negative latitude south of the equator. At this time the northern hemisphere has less sunlight and shorter days compareitively to the south, which contributes to lower average temperatures overall. The large range of variance in temperature from positive latitude 60 degrees to 80 degrees, could be an indication of global warming happening right in front of our very eyes!